
Observability vs. Monitoring: What’s the Actual Difference and Why It Matters
Observability has become one of the more abused terms in the infrastructure industry. Vendors apply it to monitoring dashboards. SaaS companies market their log aggregation tools as “full-stack observability.” Platform teams rename their Prometheus setup an “observability stack” without changing anything about it.
The conflation is not harmless. Monitoring and observability address different problems. A team that believes it has observability because it has monitoring will discover the difference at 2 AM during an incident it cannot explain with the tools available.
This post covers the actual distinction, what each requires technically, why monitoring is insufficient for distributed systems at scale, and what a practical observability maturity path looks like.

The Formal Definitions
Observability is a term borrowed from control theory, where it describes a property of a system: a system is observable if you can determine its internal state by examining its external outputs. A system is not observable if some internal states are invisible from outside — if things can happen inside the system that produce no detectable external signal.
Applied to software systems, observability is the degree to which you can understand what is happening inside a system by examining the data it emits. A highly observable system produces enough signals — with enough context — that engineers can answer arbitrary questions about system behavior. A poorly observable system produces limited signals that can only answer questions you anticipated in advance.
Monitoring is a practice: the collection and analysis of system signals to detect known failure conditions. Monitoring tells you when something is wrong. A CPU alarm fires when CPU utilization crosses a threshold. A synthetic check alerts when an endpoint returns 500. An error rate counter triggers a PagerDuty notification when it exceeds 1%.
These are different things. Monitoring requires knowing in advance what you want to watch for. Observability enables asking questions you did not anticipate.
The classic framing, attributed to Charity Majors of Honeycomb: monitoring deals with known unknowns — conditions you expected might occur and built detections for. Observability deals with unknown unknowns — the novel failure modes, the emergent behaviors, the subtle performance degradation patterns that you did not know to look for until they were happening.
The Three Pillars
The observability community has converged on three primary signal types, commonly called the three pillars.
Logs
Logs are the oldest and most universal signal type. A log event is a timestamped record of something that happened: a request was received, a database query was executed, an error was thrown, a business event occurred.
Structured logging — emitting logs as JSON objects rather than unstructured text strings — is what makes logs analytically useful at scale. Unstructured log lines require parsing with fragile regular expressions before they can be queried. Structured logs can be indexed and queried on any field without parsing.
The limitation of logs alone: they are discrete, point-in-time events. A log line tells you that something happened at a specific moment, but does not by itself tell you about the causal chain that led to it. Correlating log events across services to understand an incident requires either a shared correlation identifier (trace ID) threaded through all log events, or laborious manual correlation by timestamp — which becomes impractical at high event volumes.
Metrics
Metrics are numeric measurements sampled over time: request rates, error rates, latency percentiles, resource utilization, queue depths, active connections. Metrics are efficient to collect, store, and query because they are aggregated by design — they throw away individual event detail in exchange for time-series summaries that can be retained indefinitely and queried cheaply.
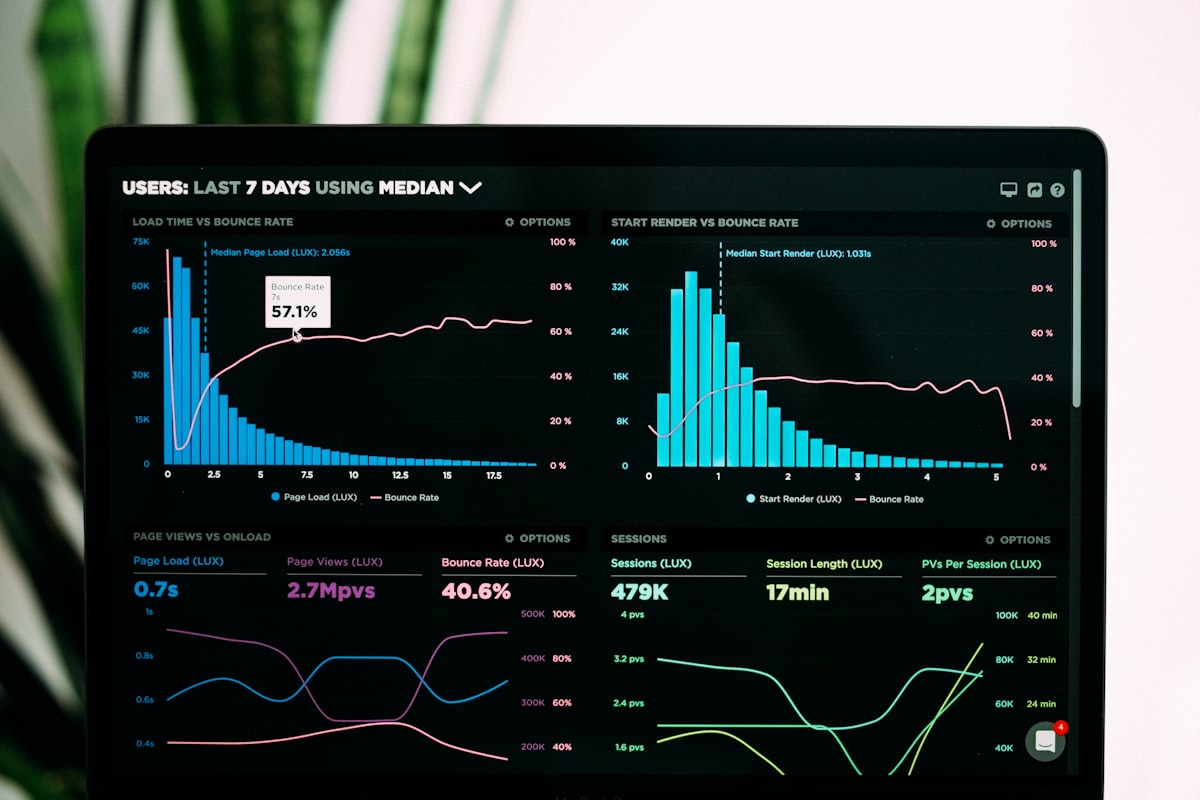
Metrics are the backbone of dashboards and alerting. The four golden signals — latency, traffic, errors, and saturation — are all metrics. Prometheus and Grafana represent the dominant open-source stack for metrics collection and visualization.
The limitation: metrics are pre-aggregated. You decide at collection time what you want to measure and what dimensions to aggregate over. If you did not instrument a particular service or did not include a particular label in your metric definition, you cannot go back later and query for it. Metrics answer questions you knew to ask. They do not answer novel questions that emerge during an incident.
The high-cardinality problem is related. Prometheus degrades badly when metrics have many unique label value combinations (high cardinality) — user IDs, session IDs, request IDs. This means the dimensions you most want during an incident investigation — “show me the latency histogram for requests from this specific customer, on this specific endpoint, using this specific code path” — are often the ones metrics cannot support.
Traces
Distributed traces represent the full execution path of a single request as it flows through multiple services. A trace consists of spans: a parent span for the top-level request, child spans for each downstream service call, database query, or external API invocation. Each span records start time, duration, service name, and arbitrary key-value attributes.
Traces answer the question monitoring and metrics cannot: where in a distributed system did this specific request spend its time, and why was it slow or did it fail? A trace for a slow API request shows that 85% of the latency came from a single database query in a third-tier service — information that would take hours to reconstruct from logs alone.
The practical requirement for traces: you need to instrument every service in the call path. A trace that covers only some services has gaps — the critical context for a cross-service issue may live in an uninstrumented service. OpenTelemetry instrumentation libraries for most languages automatically propagate trace context through HTTP headers and messaging system headers, making end-to-end traces achievable without manual context threading in every service.
The CNCF observability landscape provides a comprehensive view of tools in each category — the ecosystem is large and continues to evolve rapidly.
Why Monitoring Is Not Enough for Distributed Systems
In a monolithic application, monitoring is often sufficient. The system is simple enough that the failure modes are enumerable. If the database is slow, you see it in query latency metrics. If the application is running out of memory, you see it in heap utilization. The number of things that can go wrong is bounded, and you can instrument all of them.
Distributed systems break this assumption in several ways.
Emergent failures from interaction. In a system with 50 microservices, failures often emerge from the interaction between services rather than from the failure of any individual service. Service A is healthy. Service B is healthy. But when A calls B under a specific load pattern, a cascading timeout behavior appears that does not manifest in either service’s individual metrics. This is an emergent behavior — the kind of thing that monitoring for individual service health simply cannot detect.
The long tail of requests. Distributed systems typically show significant variance in request latency. Averages and even p99s can look healthy while a small percentage of requests experience severely degraded performance. The affected requests often share a characteristic — a specific customer, a specific data pattern, a specific code path — that you need high-cardinality data to identify. Metrics aggregated over all requests obscure the tail.
Unknown failure modes. The number of ways a 50-service distributed system can fail is combinatorially large. You cannot write detection rules for all of them in advance. A monitoring strategy based entirely on known failure patterns will always have blind spots — and in distributed systems, those blind spots grow proportionally with system complexity.
Context loss across service boundaries. A user reports that their request was slow. In a monolith, you look at the application logs for that time window. In a distributed system, the request touched eight services, three of which are owned by different teams, one of which is a vendor SaaS integration. Without distributed traces, you cannot reconstruct the path of that specific request. Log correlation by timestamp across eight services with slightly different clock synchronization is an exercise in frustration.
This is the practical case for observability over monitoring: as systems become more distributed, the fraction of problems that monitoring can detect and explain decreases. Observability fills the gap.
What Observability Actually Requires
The three pillars are necessary but not sufficient. Observability is not achieved by deploying a logs aggregator, a metrics stack, and a trace collector. It requires specific properties of those signals.
High-cardinality data. The most valuable debugging signal is usually something like “show me all requests from customer X that called endpoint Y and had a response time above 500ms, broken down by database query type.” This requires that your traces and logs carry customer ID, endpoint, and response time as indexed, queryable attributes — not aggregated away into summary statistics. High cardinality data is what makes arbitrary slicing possible.
Correlation across signals. Logs, metrics, and traces need to be linked. A trace ID should appear in every log line emitted during that request. Metrics should be annotated with enough context to navigate from an alert to the specific traces and log events that correspond to the alerting condition. Without correlation, you have three separate data silos that require manual bridging during incidents.
Queryable at incident time. The data must be available and queryable interactively, not just through pre-built dashboards. During an incident, the questions change in real time as you rule hypotheses in or out. A system that requires you to write a new dashboard or deploy a new metric before you can answer a question is not observable in the meaningful sense.
Wide events. The most useful unit of observability data is a wide event: a single record that contains all the context about a specific request or operation — the user, the endpoint, the feature flags active, the backend services called, the response status, every relevant attribute — as a single structured record. Wide events are what enable arbitrary slicing without requiring that you anticipated the query in advance.
OpenTelemetry: The Standard
OpenTelemetry has become the dominant open standard for instrumentation. It provides APIs, SDKs, and a protocol (OTLP) for generating and exporting telemetry data — logs, metrics, and traces — in a vendor-neutral format.
The practical benefit: instrument once with OpenTelemetry, and your telemetry can be exported to any compatible backend — Jaeger, Zipkin, Honeycomb, Datadog, Grafana Tempo, New Relic, or your own collector pipeline — without changing instrumentation code. This eliminates vendor lock-in at the instrumentation layer.
OpenTelemetry auto-instrumentation libraries handle the most common cases automatically: incoming HTTP requests, outgoing HTTP calls, database queries, message queue interactions. For most applications, enabling auto-instrumentation produces useful traces without any application code changes.
The collector (OpenTelemetry Collector) sits between your services and your backend. It receives telemetry via OTLP, processes it (filtering, sampling, enrichment), and exports to one or more destinations. Running the collector as a sidecar or a shared infrastructure component gives you a central control point for sampling rates, PII redaction, and routing to multiple backends.
Backend Options
The observability backend landscape has two general categories: open-source self-hosted and commercial managed services.
Open-source self-hosted:
– Metrics: Prometheus + Grafana is the dominant combination. VictoriaMetrics and Thanos provide horizontal scalability.
– Logs: Grafana Loki for cost-efficient log storage with Prometheus-like label-based querying; the ELK stack (Elasticsearch, Logstash, Kibana) for full-text search.
– Traces: Jaeger or Grafana Tempo. Tempo integrates well with Loki and Prometheus in the Grafana stack.
The Grafana stack (Prometheus + Loki + Tempo) provides good integration between all three pillars at manageable infrastructure cost, with a single Grafana UI for visualization. It is a reasonable choice for teams that want open-source and have the operational capacity to run it.
Commercial managed services:
– Datadog provides metrics, logs, traces, and a strong correlation layer in a single platform. Pricing is usage-based and can be high at scale.
– Honeycomb is purpose-built for high-cardinality event analysis. Its query interface is designed for arbitrary slicing of wide events — the most powerful tool available for the kind of interactive incident investigation observability is meant to enable.
– Grafana Cloud provides managed versions of Prometheus, Loki, and Tempo with a generous free tier.
– New Relic and Dynatrace are full-stack APM vendors with observability features.
The right choice depends on the team’s operational capacity and the nature of the problems it needs to solve. Teams with complex distributed systems and sophisticated debugging needs typically find Honeycomb’s data model more useful. Teams that want a single vendor for everything typically find Datadog’s breadth more practical.
A Practical Observability Maturity Model
Level 0 — Monitoring only. Uptime checks, CPU/memory alerts, application error rate monitoring. Binary: the thing is up or it is down. No visibility into why.
Level 1 — Structured logs and dashboards. Services emit structured JSON logs. A centralized log aggregator (Loki, Elasticsearch) enables log search. Dashboards exist for key service metrics. Teams can investigate known failure types.
Level 2 — Distributed tracing. OpenTelemetry instrumented across all services. End-to-end traces available for every request. Teams can identify which service is slow for a specific request without log correlation.
Level 3 — Correlated signals. Trace IDs present in all log events. Metric dashboards link to traces. Alert annotations navigate to relevant traces and logs. Investigation starts from a single entry point and navigates coherently across signal types.
Level 4 — High-cardinality, wide events. Services emit rich attributes on every trace span — user context, feature flags, business context. Any combination of attributes can be sliced at query time. Teams can answer novel questions during incidents without waiting for new instrumentation.
Level 5 — Continuous improvement loop. Observability data drives architectural decisions. SLOs defined and tracked as engineering artifacts. Error budget burn rates influence deployment velocity. Incident reviews systematically identify missing instrumentation and add it before the next incident.
Most engineering teams are at Level 1 or 2. Level 3 is achievable in a focused quarter. Levels 4 and 5 represent a sustained practice rather than a project — they require ongoing investment in instrumentation quality and a culture that values data-driven investigation.
The Practical Bottom Line
The distinction between monitoring and observability matters most when your system is failing in a way you did not predict. Monitoring tells you the system is failing. Observability tells you why.
For small, simple systems, monitoring is often sufficient. The investment in a full observability stack may exceed the benefit. For distributed systems with multiple services, multiple teams, and significant traffic — the kind of system where incidents routinely have non-obvious causes and involve multiple services — observability is the difference between a two-hour incident and a twelve-hour incident.
Start with OpenTelemetry instrumentation across your services. Get traces, even before you invest in a sophisticated backend. Traces alone, sent to a free-tier backend, will show you things about your system’s behavior that you cannot see from metrics and logs alone. Add correlation. Add high-cardinality context incrementally. The investment compounds: each improvement in instrumentation quality reduces the next incident’s resolution time.
Monitoring is a baseline requirement. Observability is what makes distributed systems debuggable at scale.

